0xNova profile picture

0xNova · Crypto Trader

Trading crypto since 16. Still not profitable.

A computer science background, years of screen time across crypto, FX, indices and commodities, and a net result that is still below zero. This site shows how I trade, how I test ideas, and the numbers as they are.

Started
Age 16
Background
Computer Science
Net P&L
Negative
2026
Getting back up
About

Engineer first. Trader second. Profitable: not yet.

I placed my first crypto trade at 16 and I have been in the market ever since, and I now trade FX, indices and commodities too. I am still not net profitable. I would rather say that on the first screen than have you find it out later.

My best run was January 2025, and the highlights are further down. 2026 is about getting back up.

I have a background in computer science. It has not made me a profitable trader. What it has given me is the habit of measuring things, which is how you tell a strategy that works from one that got lucky.

So this site is not just a highlight reel. It shows the process too: the framework I trade, the tools I build to test an idea before I put money on it, and the results, with the net result shown first.

Record

The numbers, net result first.

The overall result comes first and the wins come after it, so the wins are read in context.

First trade
Age 16
Markets
Crypto, FX, indices, commodities
Background
Computer Science
Net result
Not profitable, yet

Highlights · January 2025

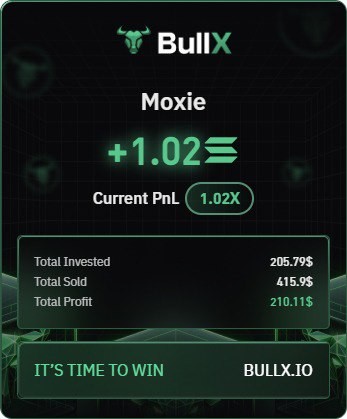
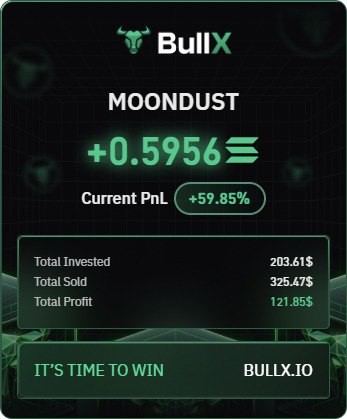
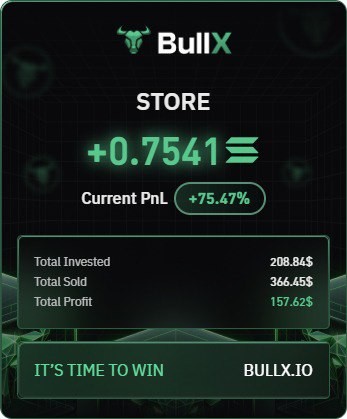
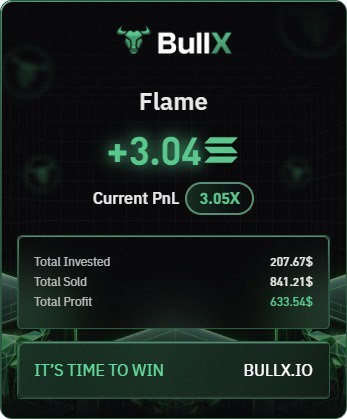
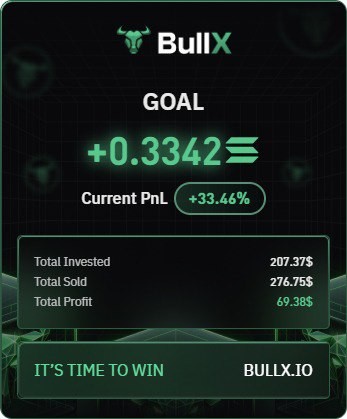
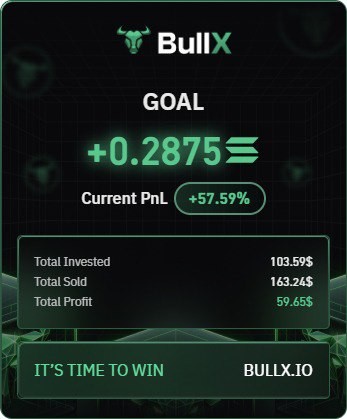
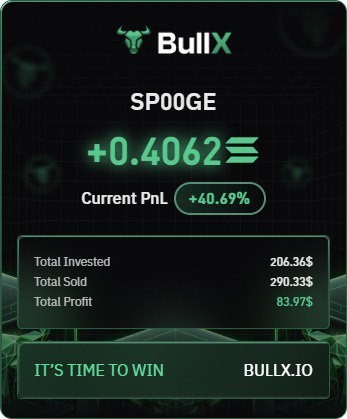
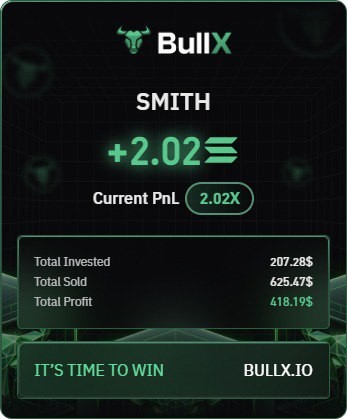
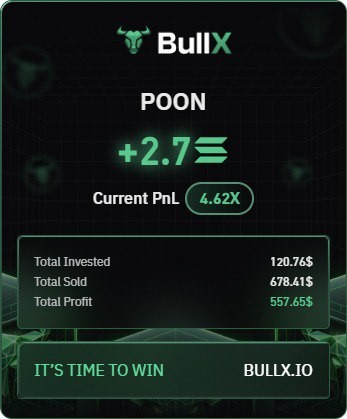
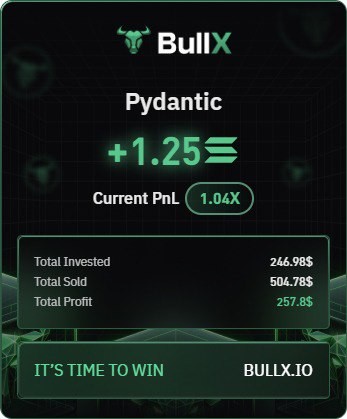
Ten of my best winning trades from January 2025, on Solana tokens, with the numbers copied from their BullX share cards. These are highlights, not the full record: the net across all my trading is still negative, and 2026 is about getting back up.

Trades shown
10
Invested in these
$1,918.25
Profit on these
+$2,569.76
Approach

How I trade now.

I trade Trader xB’s liquidity-gap framework. Price moves in fast expansions that leave gaps behind, then comes back to fill them before it moves again. The model reads every market the same way, so I use it across crypto, FX, indices and commodities.

  1. Start from the higher timeframe

    On the 4H chart, find the range: the last major swing high and low, and the untested liquidity gaps between them. A liquidity gap is the space a strong candle leaves between the wicks either side of it. Untested gaps are the targets. The daily chart and the previous day’s high and low set the bias for the day.

  2. Follow the flow, don’t predict it

    Direction comes from which way the gaps are being created and closed through, not from a trend line. The bias holds until the flow actually changes: a pullback closes back through the origin of the last expansion and starts leaving gaps the other way. Until then, trade in the same direction.

  3. Expansion, then rebalance

    Expansions are inefficient: big-bodied candles that leave gaps. Rebalances are efficient: small, wicky candles drifting back into those gaps. Sweeps of highs and lows, and candles that close through an old gap, mark where a rebalance starts or ends. The aim is to be positioned as it ends and the next expansion begins.

  4. Trigger on the 30m, enter on the 2–5m

    With the 4H direction set and the 30m agreeing, the trigger is a 30m sweep at a significant level: the high, low or midpoint of a gap. A sweep in the middle of nowhere doesn’t count. Entry comes after a 2 or 5 minute break of structure, at the candle that started it, with the stop just beyond that candle.

  5. Target the next untested gap

    The target is the next gap that hasn’t been closed through, with all or part of the position taken off at 3R. When every gap in the range is filled, the next target is the swing high or low beyond it.

  6. Keep it simple, wait for it

    A clean chart with only the gaps marked, read candle by candle. No FOMO: there is a setup most days, and waiting for the right one pays. Losses are part of a probability game. The edge is having rules and sticking to them.

Framework by Trader xB. This summary is my own.

Builds

The tools I build to test it.

The computer science background is useful here. I build the research tooling so an idea can fail on historical data before it fails with my money.

qfx

Quant research lab · FX

In progress · private

A research lab for testing trading hypotheses, built to produce trustworthy negative results as readily as positive ones. It runs on FX, one of the markets I trade. Price data is validated as it comes in, and the pass/fail criterion is written before anything is measured.

Python 3.11
Pinned exactly so a backtest reproduces next year
pandas + pyarrow
Bar data and the Parquet store
DuckDB
Queries across the stored history
pandera
Schema checks with no silent type coercion
pytest
Tests plus a mutation check
  • 324 tests over the data pipeline.
  • A mutation check breaks each data invariant in turn, and the suite catches 103 of 103.
Contact

Talk markets.

Want to compare notes, pull apart a strategy or talk about building trading tools? Get in touch.

Open to collaborate

Want to work together? Contact me.

Trading partnerships, content, communities or building trading tools: if you have an idea, I want to hear it. Email is best, and DMs on X are open.